

GitHub Actions Grafana Dashboard
Import a GitHub Actions Grafana dashboard for costs, workflow performance, failures, p95 job duration, queue delays, and repository drill-downs.
GitHub Actions Grafana dashboard for cost and performance
The Pipetrics GitHub Actions Grafana dashboard surfaces success rates, billed versus actual minutes, trigger breakdowns, queue delays, workflow duration, and repository drill-downs. Import the community dashboard GitHub Actions – pipetrics.com insights with dashboard ID 24157.
It complements the native Pipetrics UI with a long-term observability workspace that platform teams, SREs, and engineering leadership can embed into existing Grafana folders alongside infrastructure metrics. The dashboard lives on grafana.com and mirrors the JSON template we ship with every release so you can version-control changes or share them internally.
TL;DR: Click here to install the Grafana dashboard instantly.
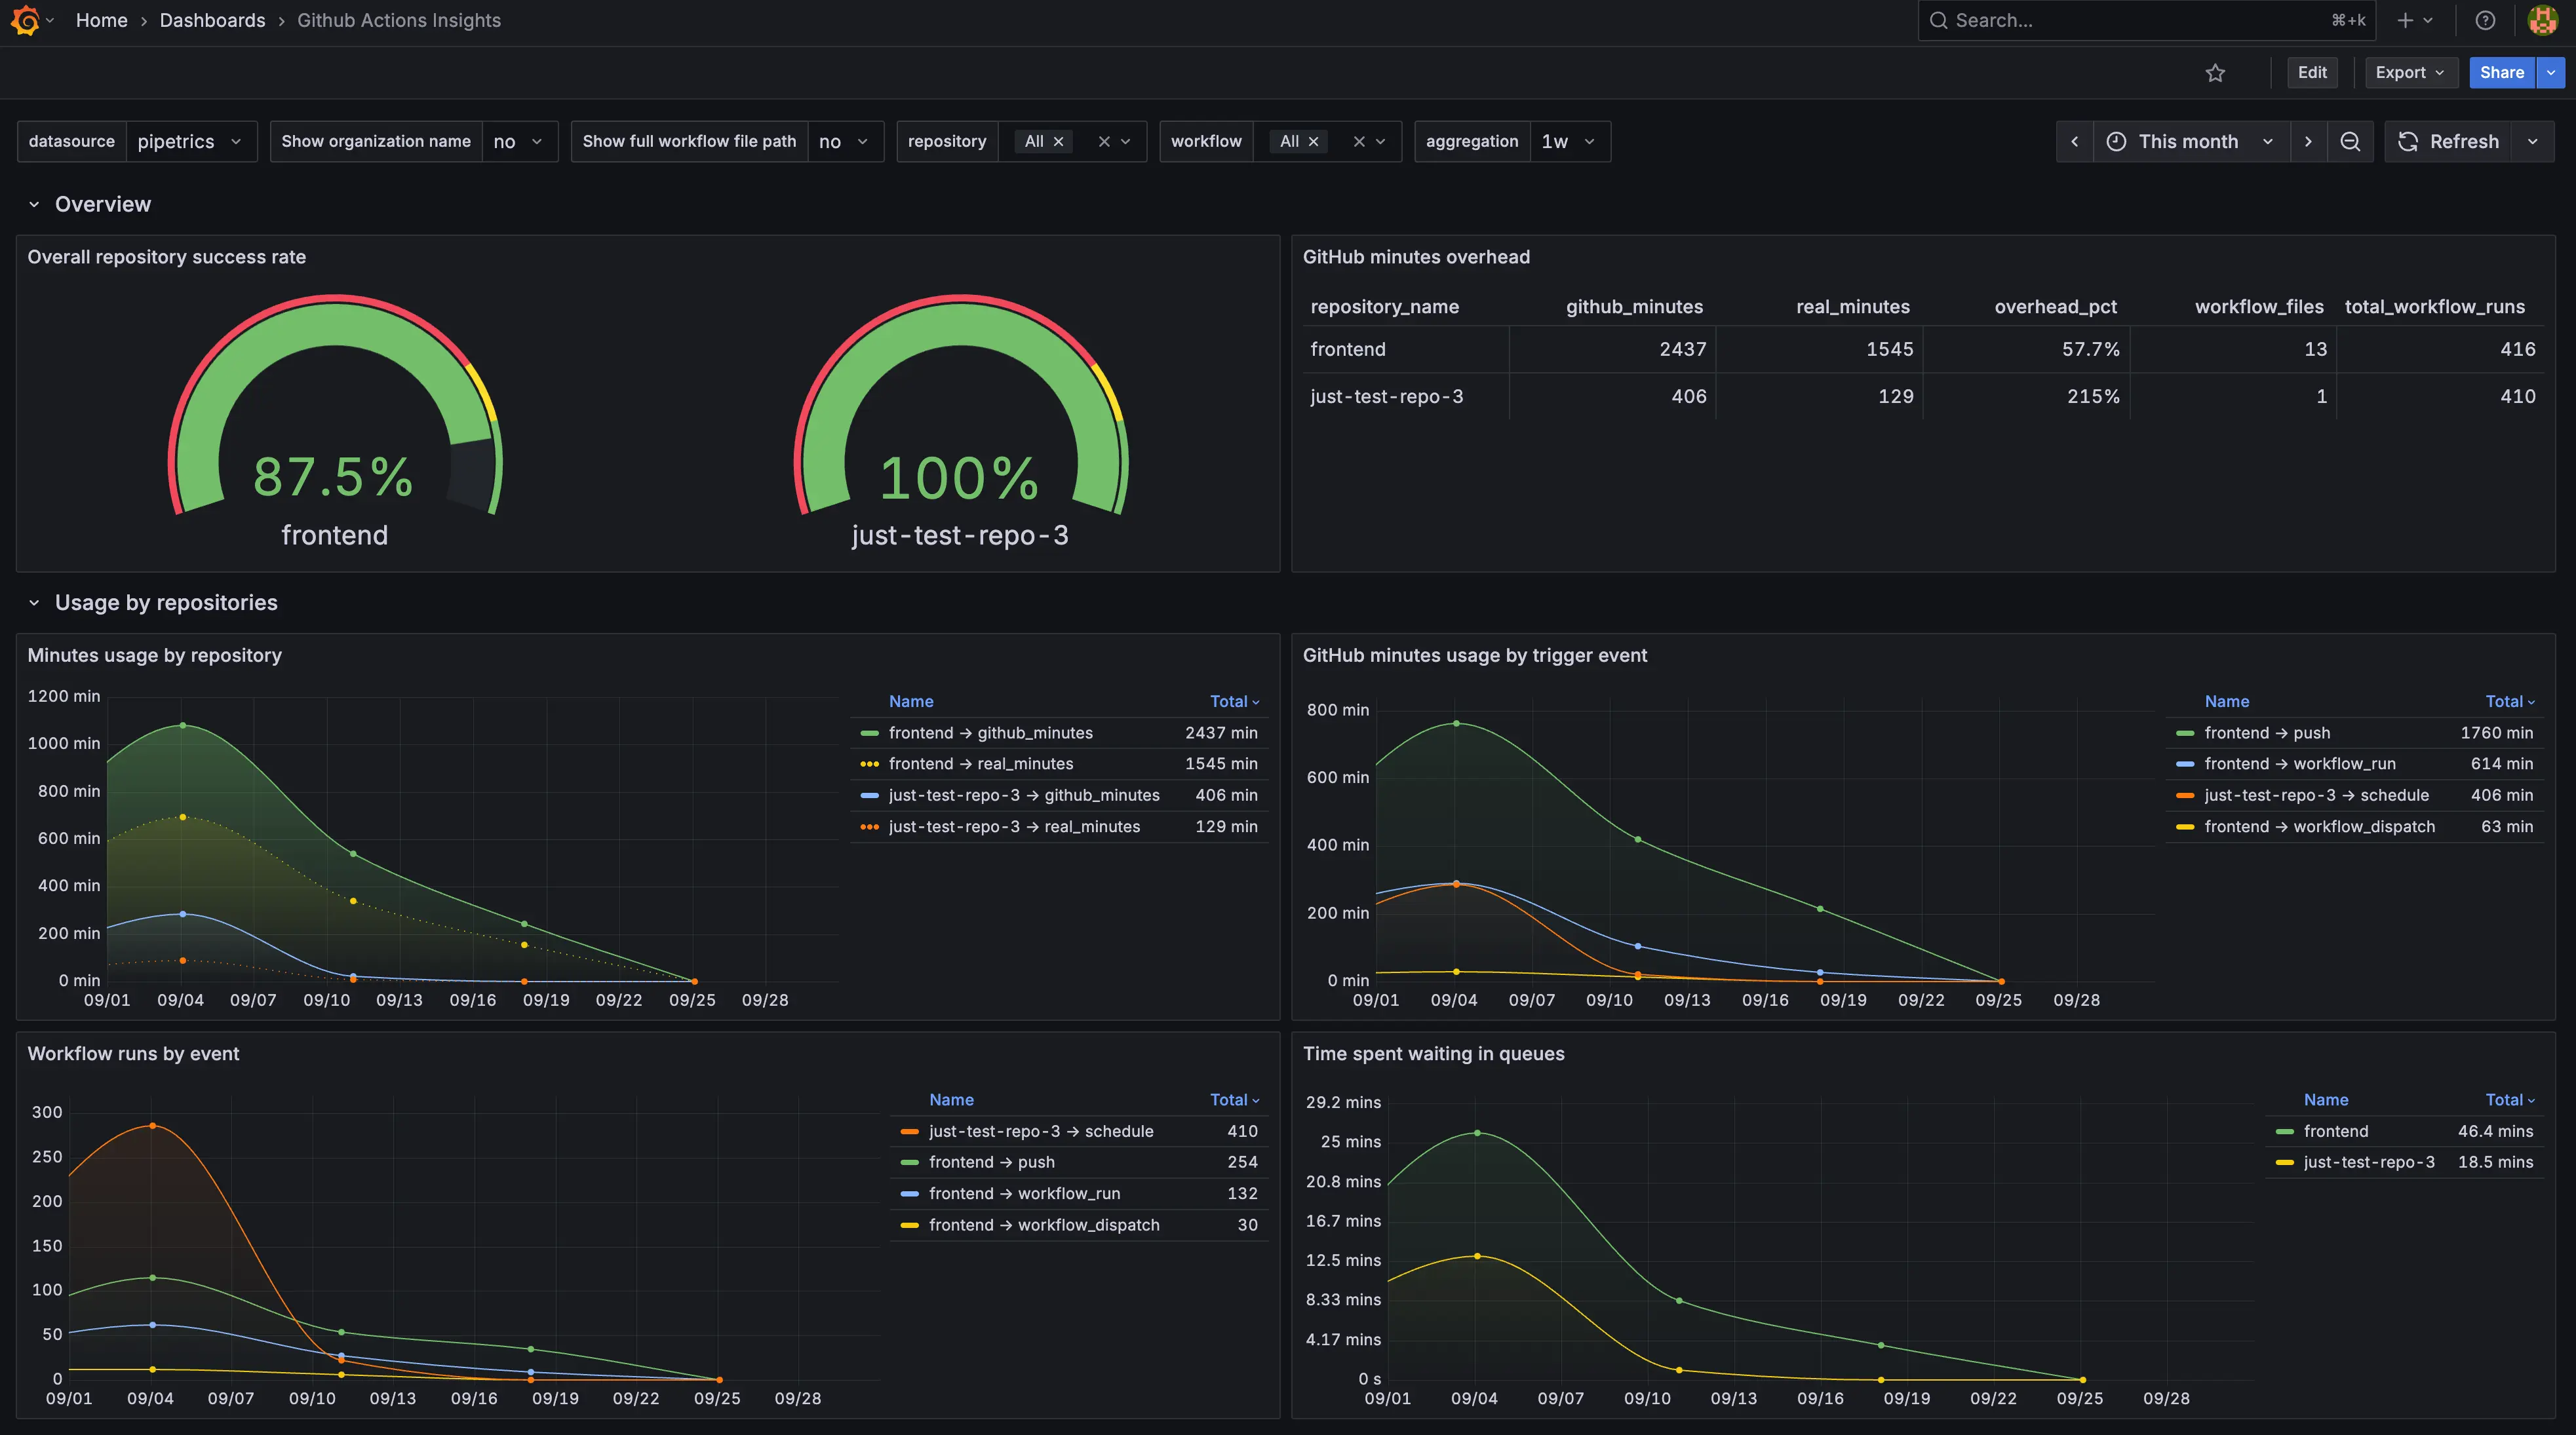
The overview shows repository success rates, billed-versus-actual minute evidence, usage by repository and trigger, and time spent waiting in queues. The minute charts show usage, not dollar costs.
Grafana dashboard prerequisites
- A Pipetrics workspace connected through the GitHub App integration.
- Grafana 9+ (cloud or self-hosted) with permission to import community dashboards.
- Network access from Grafana to the Pipetrics PostgreSQL warehouse and a read-only database user.
- Optional: reference docs in the FAQ if you need clarification about required GitHub permissions.
Key capabilities
- Reliability at a glance – repository success gauges, execution outcome tables, and p95 job durations highlight failing workflows before they impact releases.
- Cost visibility – panels comparing billed vs. actual minutes plus workflow/minute usage by repo quickly surface wasted GitHub Actions spend.
- Operational bottlenecks – queue wait time charts and trigger/event filters make it easy to spot when runners are saturated or when certain triggers dominate capacity.
- Flexible filtering – built‑in controls let you hide org prefixes, switch between workflow file paths or aliases, and slice by repo, workflow, or time window without editing the SQL.
Because every visualization is backed by SQL already tuned for Pipetrics' schema, you can ship this dashboard to any environment that can reach the Pipetrics warehouse with zero code changes. Analysts can create derivatives by duplicating the base board and editing the queries without touching production.
Is Grafana an alternative to GitHub Actions?
No. GitHub Actions runs the workflows; Grafana visualizes telemetry collected from those runs. The Pipetrics dashboard connects the two: Pipetrics collects and models GitHub Actions data, while Grafana provides a familiar place to explore it alongside infrastructure and application metrics.
Grafana dashboard installation options
Option 1 – Import directly from grafana.com
- In Grafana choose Dashboards → New → Import.
- Paste the dashboard ID
24157(or the URLhttps://grafana.com/grafana/dashboards/24157-github-actions-insights/). - Select the Pipetrics PostgreSQL data source (details below) when prompted, then click Import. Grafana will render the full layout instantly, including dropdown variables such as
repository,showOrgName, andworkflow.
Option 2 – Import the JSON bundled in this repo
- Download the Pipetrics Grafana JSON template bundled with the release (or request it from the Pipetrics team if you need an updated copy).
- In Grafana, open Dashboards → New → Import and upload the JSON file.
- When Grafana asks for inputs, map
DS_PIPETRICSto your Pipetrics PostgreSQL data source (or create it if it does not exist). The template already pins the required plugin tografana-postgresql-datasource, so no panel edits are needed afterward.
Both approaches yield the exact same layout; the grafana.com route is fastest for cloud-hosted instances that can reach the public catalog, while the JSON file is convenient for air‑gapped workspaces or GitOps flows.
Configure the Grafana pipetrics data source
The dashboard expects a PostgreSQL data source named pipetrics (UID referenced by ${DS_PIPETRICS} in the template). Configure it as follows:
- Database – the Pipetrics analytics database that contains tables such as
minion_workflow_runs,minion_repositories, andminion_workflow_jobs. - Authentication – read-only credentials; no write access is needed.
- TLS – enable if your Pipetrics instance enforces SSL (recommended in production).
- Timezone – keep "Default" so Grafana respects each user's preference; all SQL uses
__timeFilterto align with the dashboard's range picker.
After saving the data source, hit Test & Save to confirm Grafana can reach the database before refreshing the dashboard. A successful check means the dashboard variables (repository, workflow, event) can populate automatically, eliminating manual copy/paste of identifiers.
How to use the Grafana dashboard
Start with the Overview row
- Overall repository success rate gauge immediately shows if any repo is slipping below the 85% "green" threshold, making it the go/no-go indicator for your release train.
- GitHub minutes overhead compares billed vs. actual runtime; aim to keep overhead low to avoid paying for idle runner time.
- Usage by repositories / Minutes usage by workflow panels tell you which repos or workflows are eating most of your monthly allotment.
Slice by events and queues
- Use the Workflow runs by event and GitHub minutes usage by trigger event charts to see whether
pull_request,push, or scheduled runs dominate your fleet. - Time spent waiting in queues helps identify periods of runner delay. Investigate runner capacity and concurrency policies before deciding what to change.
Drill into reliability
- Executions by conclusion stacks successes vs. failures vs. skipped/cancelled runs, so you can track regression spikes after a deployment.
- Workflow jobs time p95 shows job duration at the 95th percentile; compare it with the queue chart when investigating slow feedback.
- Finished workflow runs by result lets you compare trends across multiple repos in a single panel, ideal for cross-team reliability reviews.
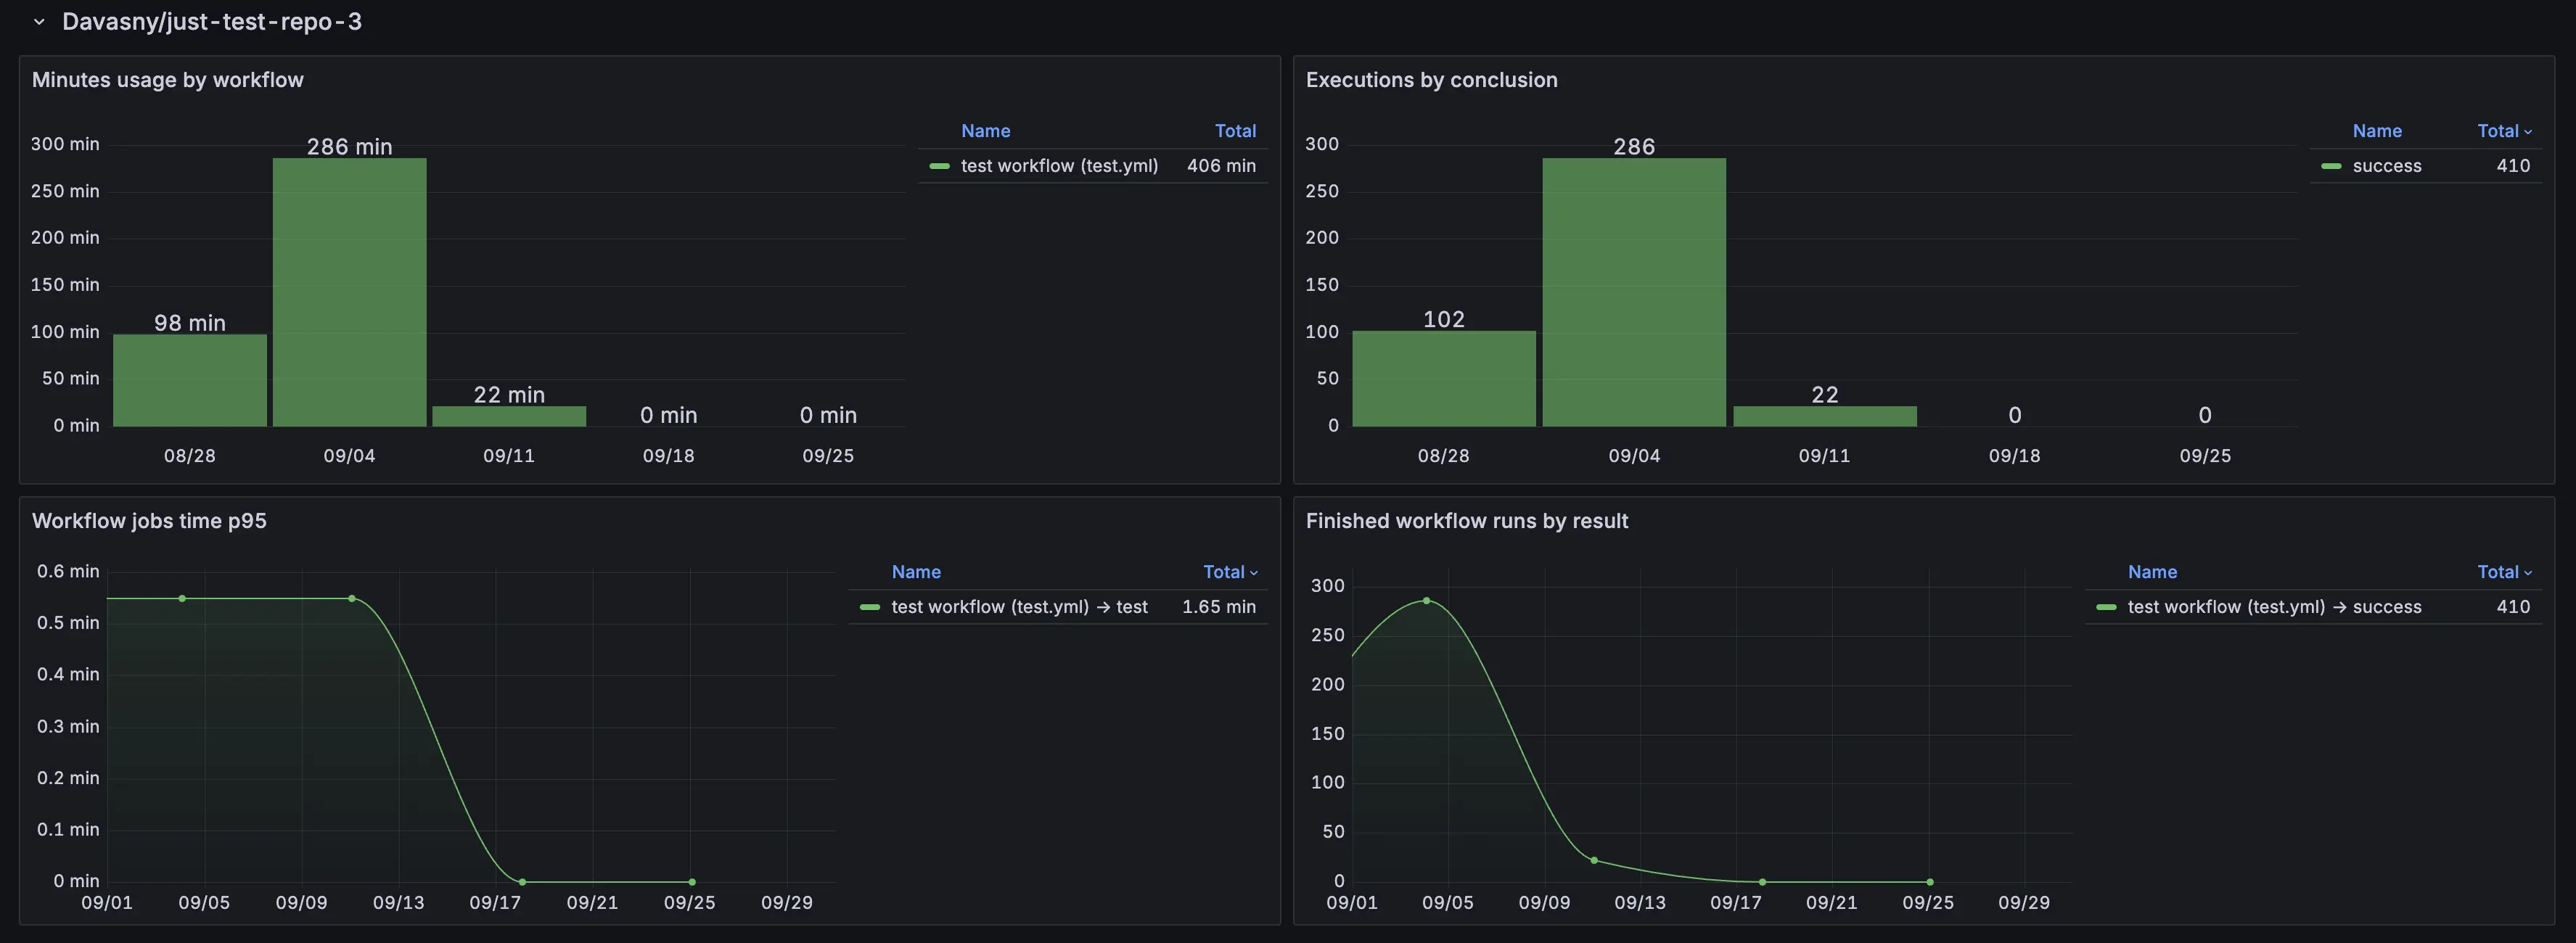
This repository view shows workflow minutes, outcomes, and p95 job duration. The queue chart is in the overview above; compare equivalent time periods before linking queue delay to a slow job.
Grafana troubleshooting and customization tips
- Panels look empty? Confirm the
repositoryvariable contains at least one repo slug found inminion_repositories. During first-run testing, select a single repository to keep query cost low. - Unexpected minute totals? Inspect the GitHub minutes overhead panel's query inside Grafana; it compares
billed_minutesandactual_minutesfields. If you replicate the board elsewhere, ensure your Pipetrics ETL populates both columns. - Latency in queue charts? The Time spent waiting in queues panel aggregates job delay fields. If you annotate your runners (production vs. staging), duplicate the panel and add a
WHEREclause to split the visualization per runner group. - Branding adjustments – Because the JSON is fully editable, you can replace the Pipetrics color palette with your org's palette by editing the panel overrides or applying a dashboard-level theme.
Why this Grafana dashboard is helpful
- Shared observability language – engineering, SRE, and leadership can reference the same Grafana board during standups or incident reviews.
- Faster remediation – filters plus per-repo drilldowns show exactly which workflow or trigger needs attention, so teams fix issues before SLAs slip.
- Cost accountability – billed minutes vs. actual runtime makes GitHub Actions spend tangible, supporting conversations with finance or platform leads.
Pairing this dashboard with Pipetrics' in-app insights gives you both high-fidelity historical data (Grafana) and lightweight sharing links for stakeholders who do not live in Grafana every day. To keep iterating, sync the Pipetrics GitHub App first via the integration guide, then review the FAQ for GitHub Actions permission details before extending the Grafana experience with additional filters, alerts, or data sources.
If your immediate question is financial, start with GitHub Actions cost monitoring. To investigate slow jobs and regressions, use the GitHub Actions performance monitoring guide. The dashboard supports both workflows without forcing teams to leave Grafana.
GitHub Actions Grafana dashboard questions
What metrics are included?
The dashboard includes workflow outcomes, repository success rate, billed and actual minutes, usage by repository and workflow, trigger events, queue delay, and p95 job duration. Available values depend on the telemetry in your Pipetrics workspace.
Does the dashboard require Prometheus?
No. The published dashboard uses the Grafana PostgreSQL data source and the Pipetrics analytics database. You do not need to deploy or maintain a Prometheus exporter for GitHub Actions.
Can I customize the dashboard?
Yes. Duplicate panels, edit their SQL, change thresholds, add alerts, and apply your organization’s Grafana theme. Keep the original dashboard available as a reference when upgrading the template.
Can the dashboard show GitHub Actions costs?
It shows billed-versus-actual minute evidence and usage by repository and workflow. For interactive billing-category, outcome, branch, trigger, and runner filtering, use Pipetrics Cost Profiler.
Next steps with the Grafana dashboard
- Finish connecting your repositories via the GitHub App if you have not already.
- Import the dashboard, assign the
pipetricsdata source, and validate the dropdown filters. - Share the board with your delivery teams so they can bookmark the Grafana view and subscribe to alerts.
Already know which repository needs attention? Analyze it in Pipetrics and move from the dashboard signal to workflow, job, step, and commit evidence.