

Pipetrics Cost Profiler: GitHub Actions Costs
Use Pipetrics Cost Profiler to analyze GitHub Actions costs by repository, workflow, job, runner, outcome, trigger, branch, and billing category.
Pipetrics Cost Profiler turns GitHub Actions cost analysis into a drill-down from organization to repository, workflow, job, and step. As a result, you can identify which workflow costs the most and where failed runs waste money.
For a broader overview of the problem and available metrics, read GitHub Actions cost monitoring. This page explains how to use the Pipetrics product.
Start with the Pipetrics Cost Profiler overview
First, open Cost Profiler from an organization in the Pipetrics sidebar. The initial flamegraph represents the selected period. Larger blocks account for a larger share of modeled GitHub Actions cost.
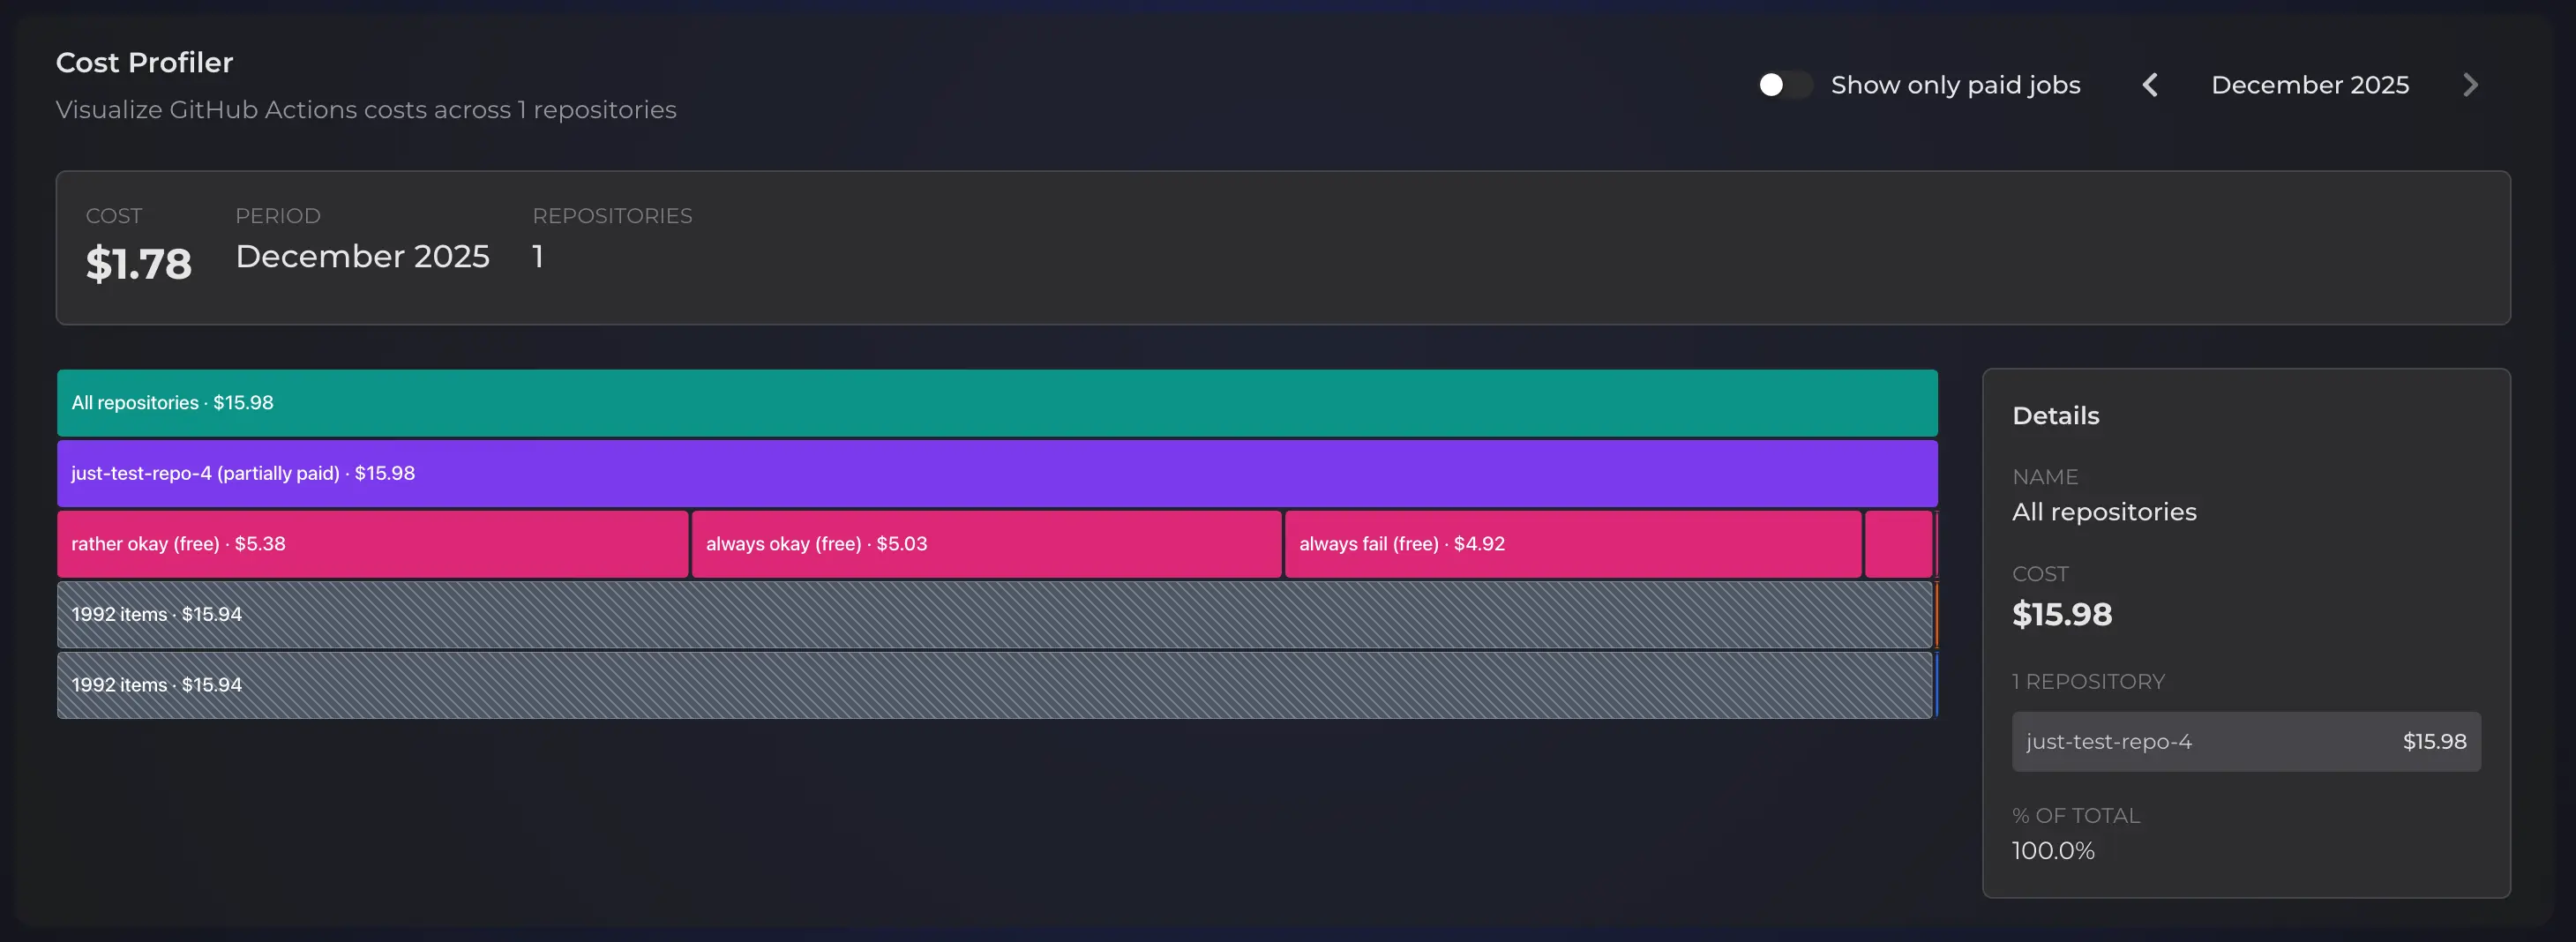
Use the overview to answer:
- Which repository accounts for the largest share of usage?
- Is cost concentrated in one repository or spread across the organization?
- Does paid usage tell a different story from total modeled usage?
- Which repository should the team investigate first?
Cost Profiler models runner usage at GitHub list prices. However, estimated billable values use available plan and included-minute evidence; they are not a replacement for the final GitHub invoice.
Find which GitHub Actions workflow costs the most
Next, select a repository block to move one level deeper. Cost Profiler redraws the flamegraph using workflow files from that repository. The details panel and breadcrumbs preserve context as you investigate.
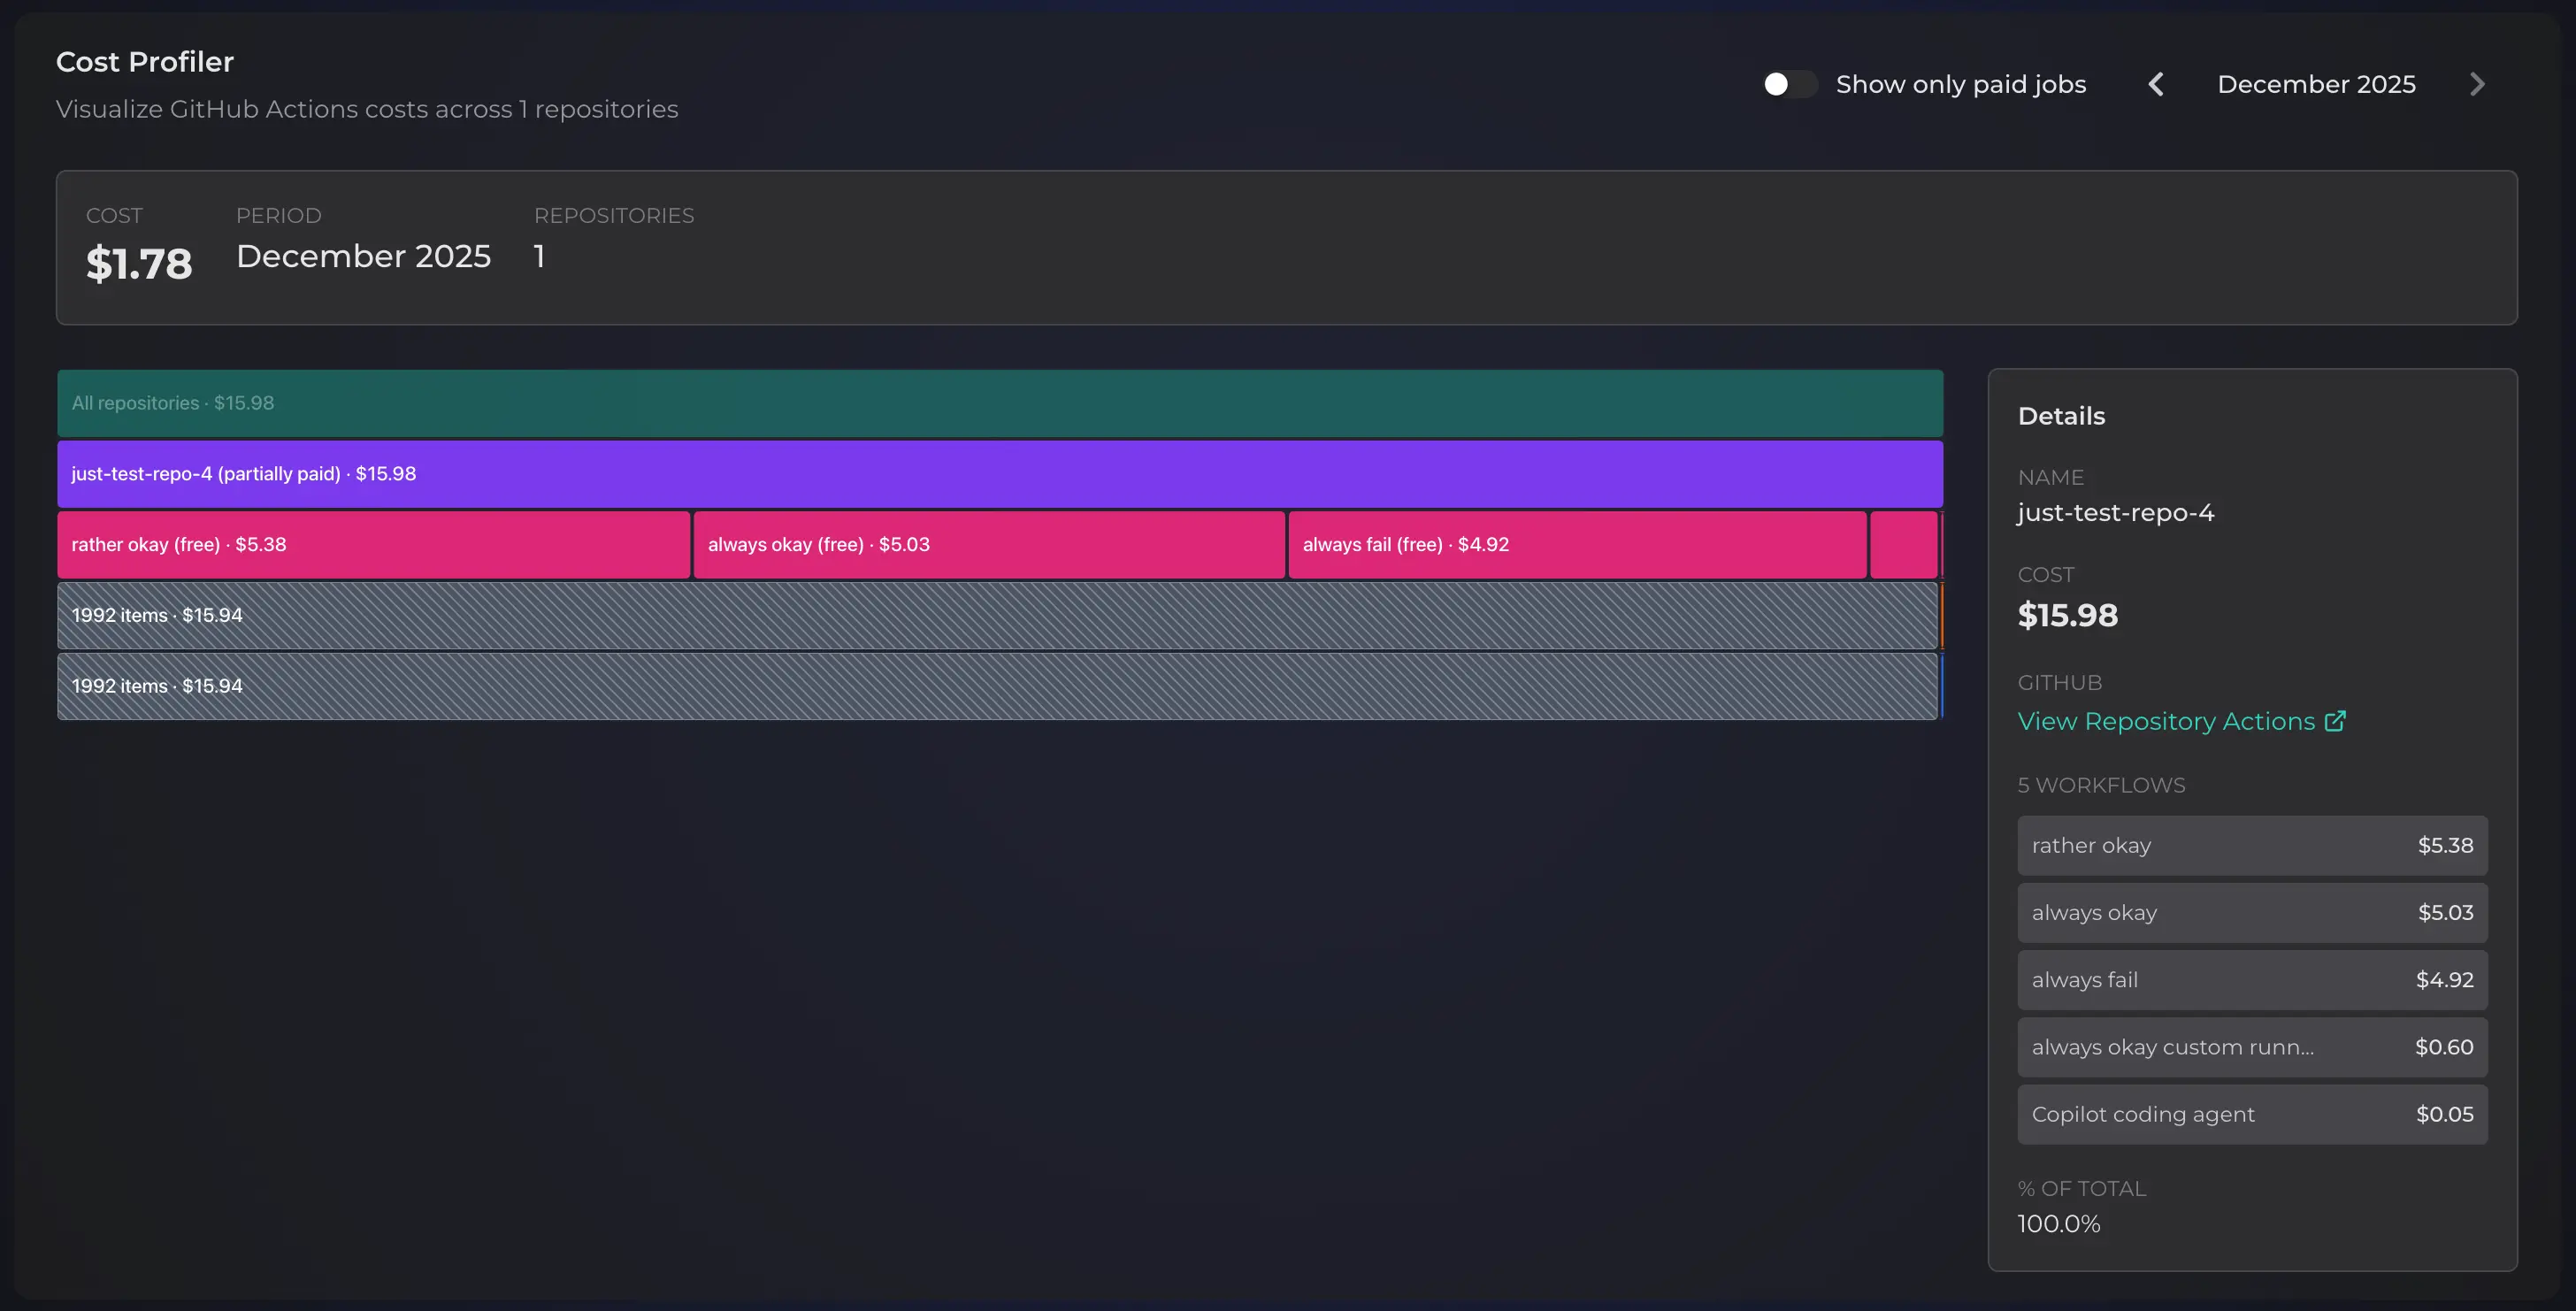
At workflow level, compare total modeled cost with execution count and runtime. For example, a workflow can become expensive because it runs often, uses a higher-rate runner, or repeats work after failures. Each cause needs a different fix.
Then continue into jobs and steps when the workflow total is not specific enough. Rank work by total impact rather than optimizing the longest single run in isolation.
Find failed spend with Pipetrics Cost Profiler
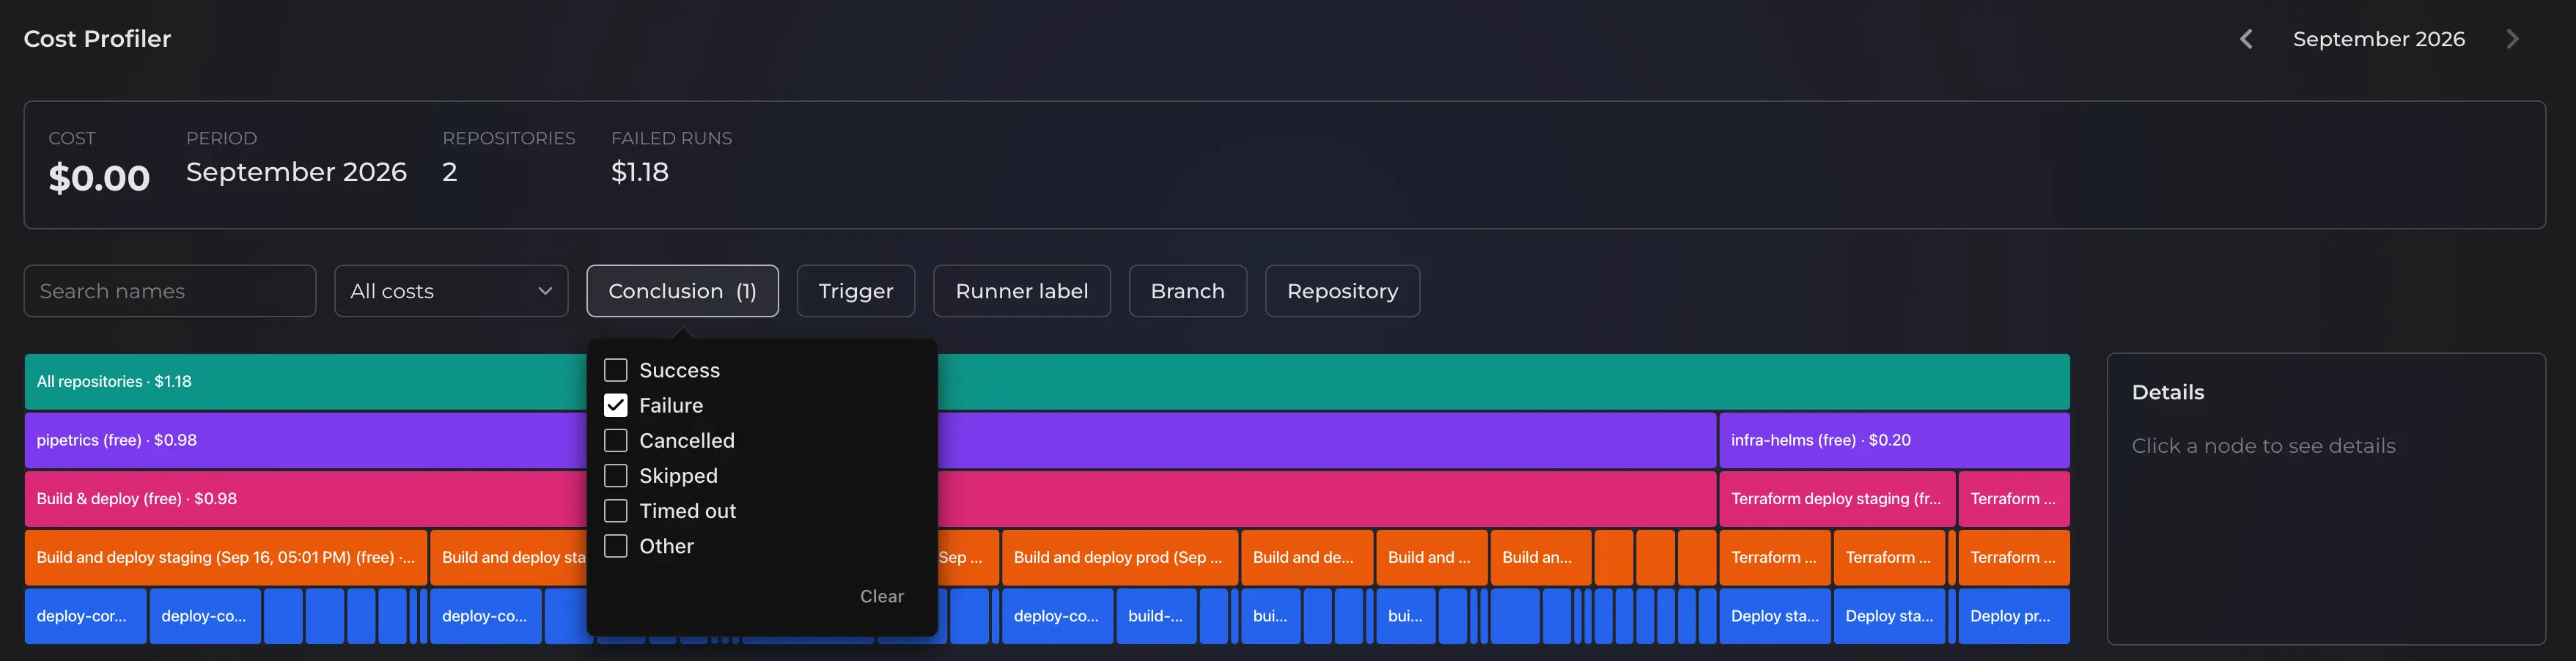
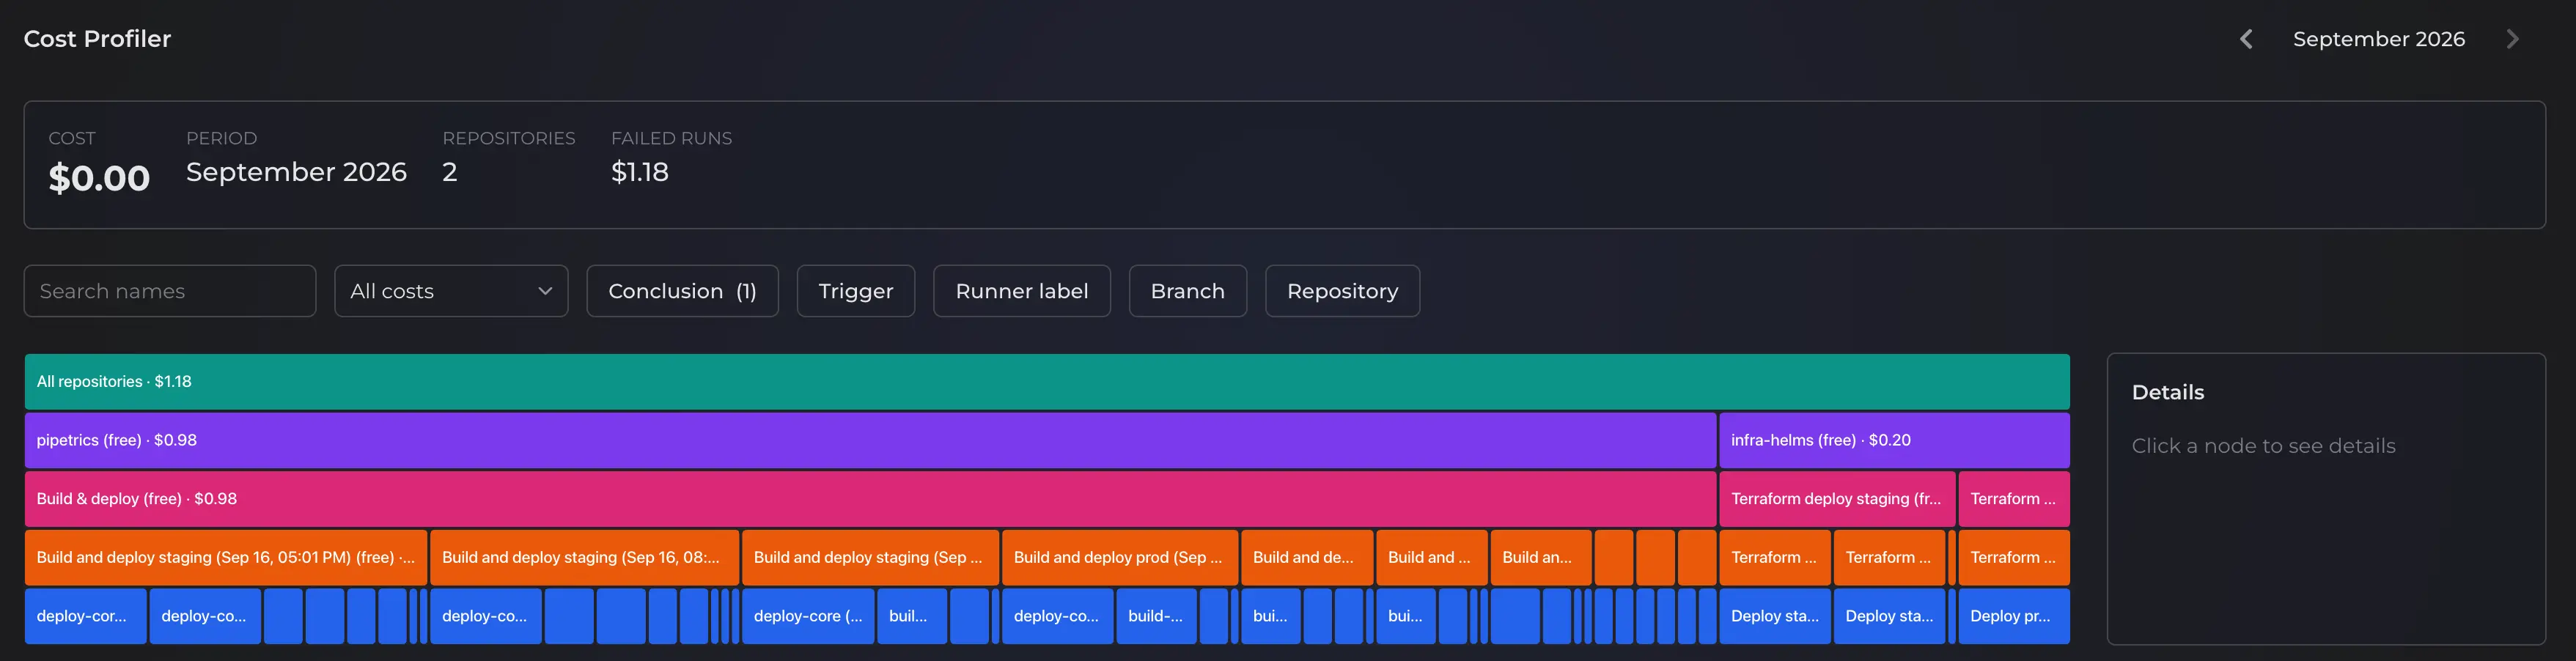
To isolate failed usage, open the Conclusion filter and select failure. The flamegraph then shows the repositories, workflows, and jobs responsible in the selected period.
However, do not rank failures by count alone. A frequently failing two-second check and an occasionally failing forty-minute deployment have different cost and feedback impact. Therefore, compare failed runtime, modeled failed cost, and where the failure occurs in the job.
Valid retry and rerun attempts remain in Pipetrics analysis because GitHub Actions performed that work. In contrast, skipped jobs and invalid reversed timestamp intervals are excluded from runtime and cost calculations.
Review a monthly cost baseline
Select one month at a time and record the repository, workflow, and filter settings used for your review. The month navigation lets you inspect retained history; however, Cost Profiler does not display a side-by-side cost comparison. Pro retains up to 360 days, while Free workspaces analyze their current retained window.
If you compare figures you recorded from different months, check these possible explanations before attributing a change to one cause:
- Execution count: more pushes, pull requests, schedules, or releases triggered the workflow.
- Duration: the same workflow became slower at median or p95.
- Outcome mix: failures and reruns added work.
- Runner mix: jobs moved to a different operating system, size, or label.
- Workflow structure: a matrix expanded or a new job started running.
Use GitHub Actions performance monitoring to inspect duration and regression evidence after Cost Profiler identifies the repository or workflow responsible.
Use Pipetrics Cost Profiler filters

For a focused investigation, combine filters to isolate a hypothesis:
- Billing category: all, billable, free-tier, or always-free usage.
- Conclusion: successful, failed, cancelled, skipped, or other outcomes.
- Trigger: push, pull request, schedule, workflow dispatch, and other GitHub events.
- Runner label: compare operating systems, sizes, or self-hosted groups represented in the telemetry.
- Branch: separate default-branch, release, and feature-branch usage.
- Repository: focus the organization view without losing the selected period and other filters.
Search narrows long lists by name. Breadcrumbs also return to the previous level without resetting the investigation.
A practical weekly GitHub Actions cost review
- Select a stable weekly or monthly period.
- Record the organization total and highest-cost repositories.
- Filter to failed outcomes and note the workflows with the most failed runtime.
- Compare runner and trigger filters for the highest-cost workflow.
- Drill into its jobs and steps.
- Choose one change with a measurable expected effect.
- Record figures from a later period separately and review them against the original baseline.
Read how to reduce GitHub Actions costs for trigger, caching, matrix, concurrency, failure, artifact, and runner optimization techniques.
Cost Profiler access and data retention
| Capability | Free | Pro |
|---|---|---|
| Cost Profiler | Included | Included |
| Telemetry retention | 14 days | 360 days |
| Longer historical baselines | No | Yes |
Your Pipetrics plan controls telemetry retention. Your GitHub plan controls included GitHub Actions usage. Upgrading Pipetrics does not change GitHub billing.
Get started
First, complete the read-only GitHub App integration and activate at least one repository. After Pipetrics collects workflow runs, open Cost Profiler, select a period, and begin at organization level.
Open Pipetrics to analyze GitHub Actions cost, or connect Pipetrics MCP to investigate the same telemetry from a compatible coding agent.
MCP
Use Pipetrics MCP for GitHub Actions optimization in Codex, Claude Code, and OpenCode. Analyze CI/CD time, cost, failures, and workflow bottlenecks.
Pipetrics Slack Integration for GitHub Actions Notifications
Configure the Pipetrics Slack integration for GitHub Actions workflow notifications, channel rules, outcome filters, and multiple Slack workspaces.